About
Senior Data Engineer | AWS/GCP & ETL/ELT Specialist | Tech Mentor
Hello there! I’m an accomplished Senior Data Engineer with 7 years of experience, dedicated to transforming complex data into actionable insights. With a focus on AWS and GCP services and ETL/ELT processes, I build robust data pipelines that power intelligent decision-making.
- Programming Languages: Python, SQL, Bash
- Cloud Platforms: AWS, GCP
- AWS Services: S3, Glue, Lambda, Redshift
- GCP Services: BigQuery, Dataflow, Cloud Storage, Pub/Sub
- Databases & Data Warehouses: PostgreSQL, MySQL, BigQuery, Snowflake, SQLite
- Data Processing & Orchestration: Databricks, Airflow, Prefect, Dagster, Spark, PySpark
- Data Modeling & Transformation: dbt, Trino, Iceberg, Delta, DuckDB
- Data Quality & Metadata Management: OpenMetadata
- DevOps & Version Control: Git, GitHub, Docker, Docker Compose, Dev Containers
- Business Intelligence & Visualization: Power BI, Tableau
- Methodologies: SAFe Scrum, Agile
Let's Make Connections. I'm eager to contribute my technical expertise to a team that's all about progress and innovation. If you’re scouting for a Senior Data Engineer, let’s chat!
Pokémon -
Delta Lakehouse
End-to-end batch data pipeline on Pokémon Data with Delta Lakehouse Architecture.
More

OVERVIEW
The PokéAPI Data Pipeline project is a project that aims to create a data pipeline to extract, load, and transform data from the PokéAPI into a Delta Lakehouse. The project uses Python, DuckDB, MinIO, Docker, Docker Compose, Dev Container, and Poetry.
About PokéAPI
The PokéAPI is a RESTful API that provides data about the Pokémon games. The API provides data about the Pokémon species, abilities, moves, types, and more.
Pokemon is a media franchise created by Satoshi Tajiri and Ken Sugimori and is managed by The Pokémon Company, a collaboration between Nintendo, Game Freak, and Creatures. The franchise was created by Satoshi Tajiri and Ken Sugimori and is centered on fictional creatures called "Pokémon", which humans, known as Pokémon Trainers, catch and train to battle each other for sport.
The goal of the PokéAPI Data Pipeline project is to create a Delta Lakehouse with the data provided by the PokéAPI.
Technologies
The PokéAPI Data Pipeline project uses the following technologies:
Problem Statement
Data
The data selected for the project is the Pokémon provided by the PokéAPI. The data includes the pokémons details for all the pokémons available in the API.
The data descriptions is available in the PokéAPI Documentation.
Data Pipeline Overview
This is a batch data pipeline that extracts data from the PokéAPI, transforms the data into a delta format and loads the data into a Delta Lakehouse.
The ELT steps are as follows:
- Extract: Extract the data from the PokéAPI and store it in a raw format in the staging area.
- Load: Load the data into a staging area.
- Transform: Transform the data into a delta format it into the Delta Lakehouse.
Medallion Architecture
The Medallion Architecture is a data architecture that uses the following components:
- Raw: The Raw layer is the raw data layer that stores the raw data extracted from the source.
- Bronze: The Bronze layer is the transformed data layer that stores the transformed data in a delta format.
- Silver: The Silver layer is the curated data layer that stores the curated data in a delta format.
- Gold: The Gold layer is the business data layer that stores the business data in a delta format.
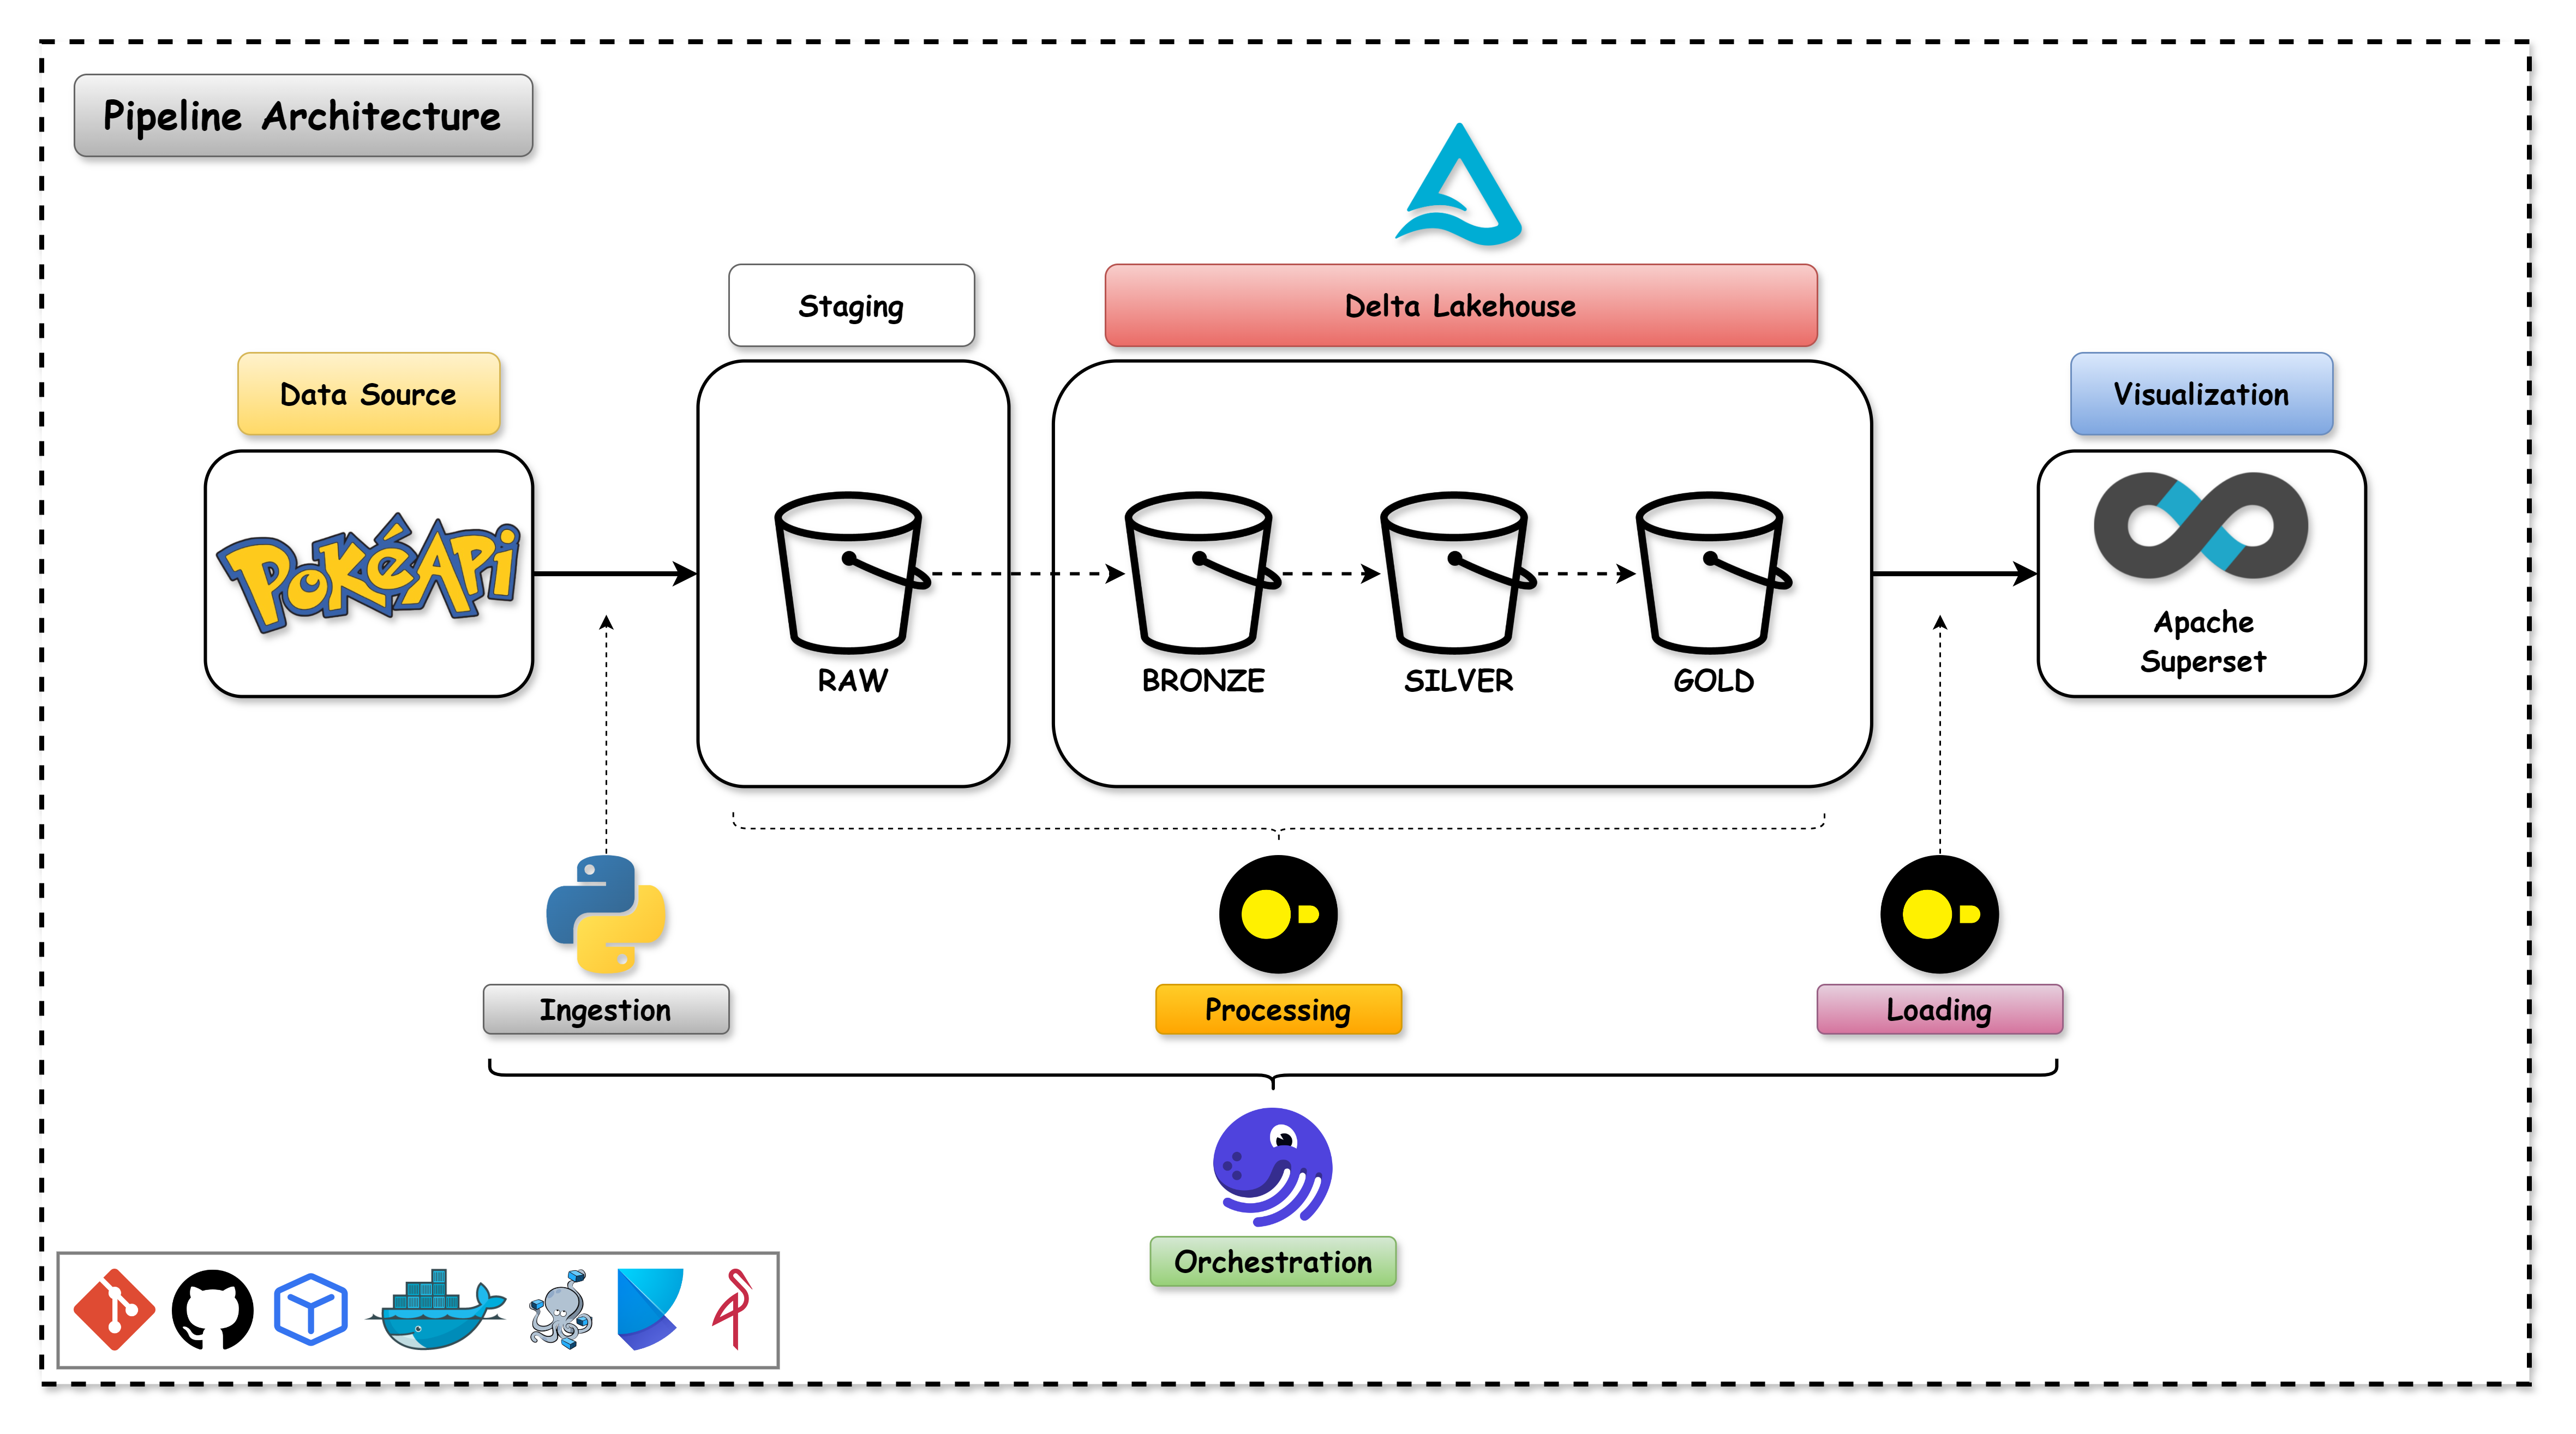
Pipeline Architecture
The architecture of the data pipeline is as follows:
Results
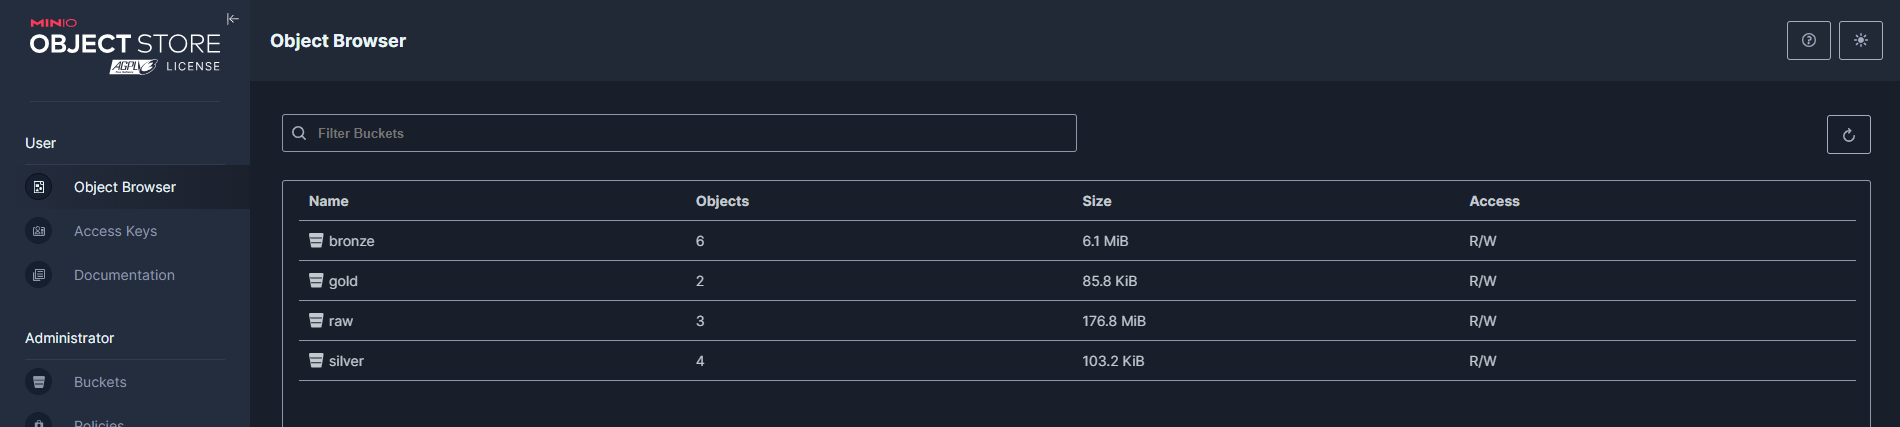
Delta Lakehouse
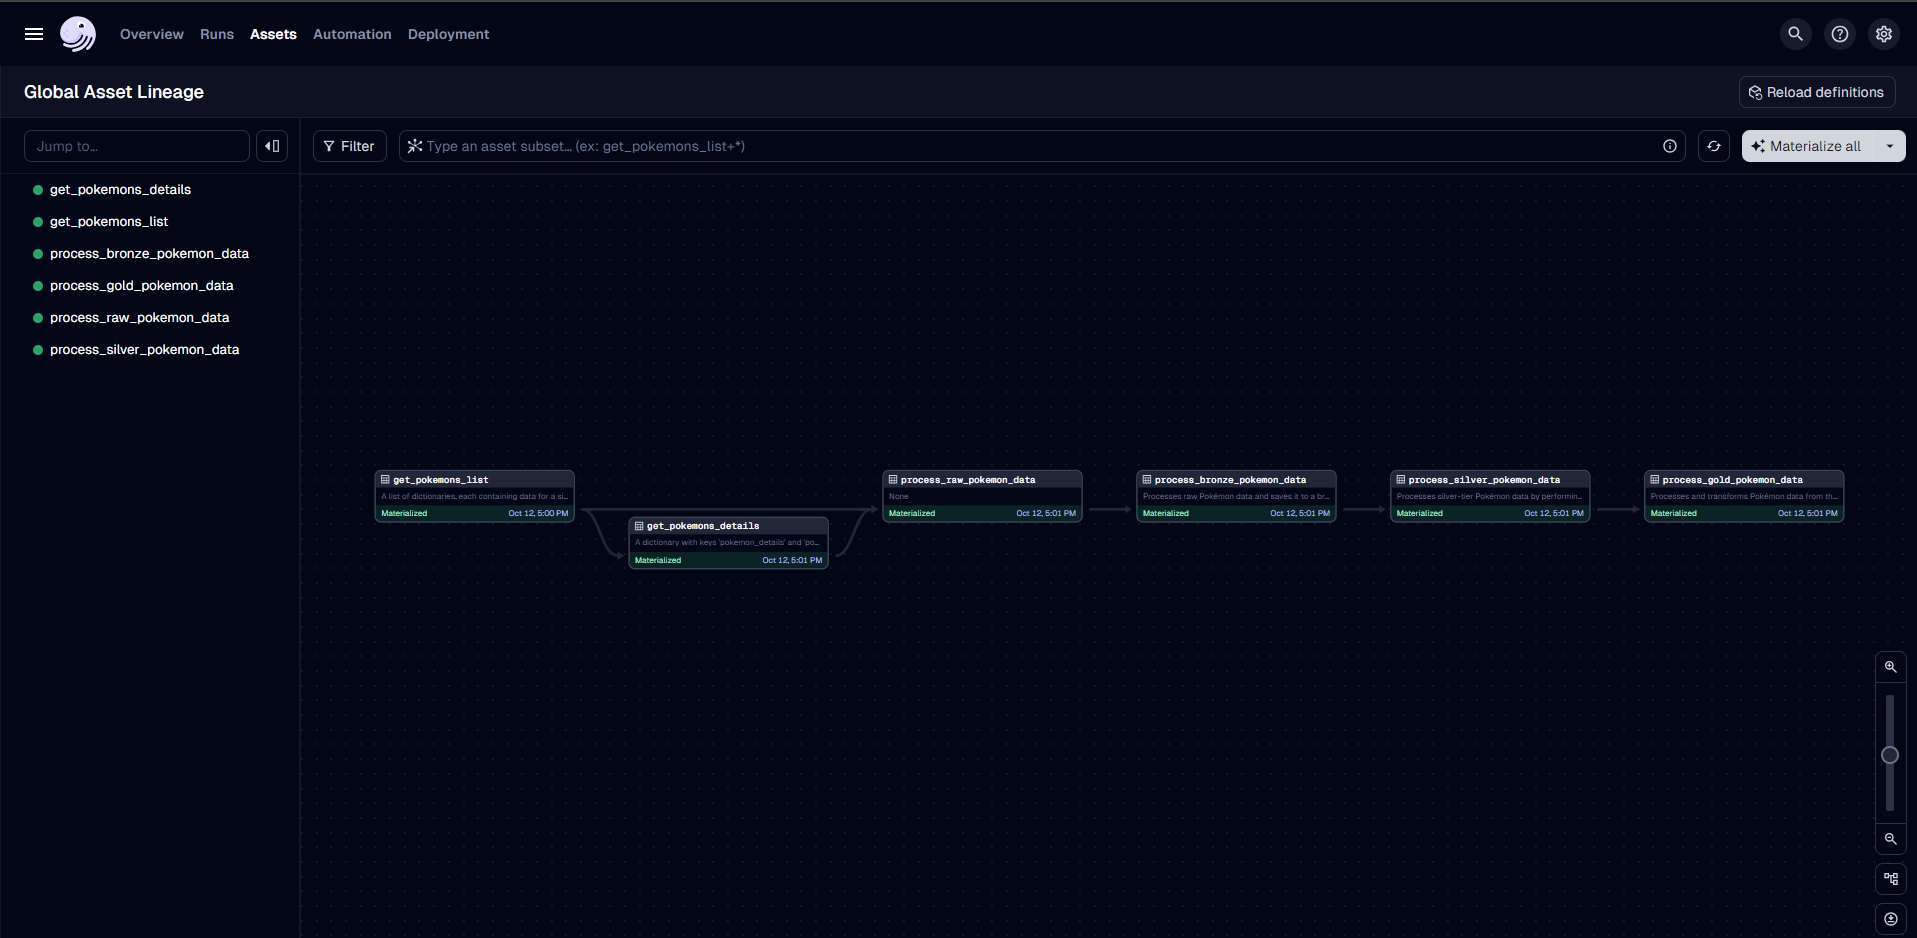
Orchestration
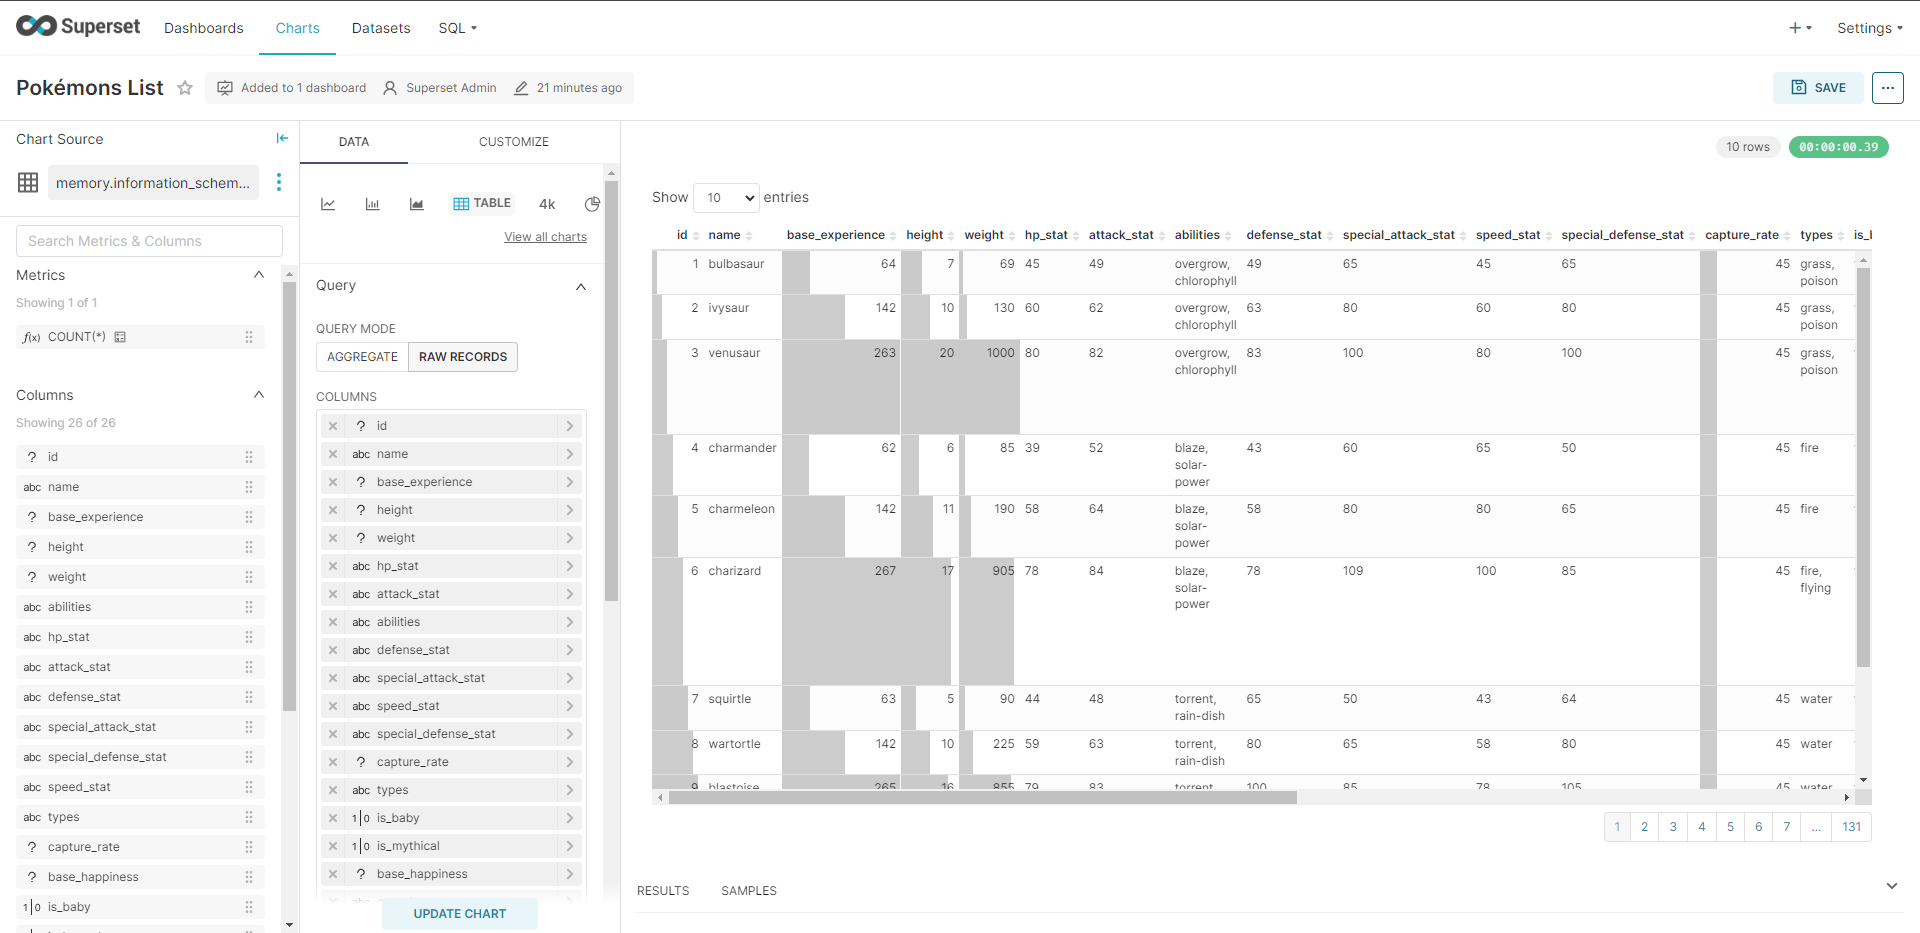
Data Visualization
Conclusion
The PokéAPI Data Pipeline project is a project that aims to create a data pipeline to extract, load, and transform data from the PokéAPI into a Delta Lakehouse. The project uses Python, DuckDB, MinIO, Docker, Docker Compose, Dev Container, and Poetry.
The full project can be viewed on my GitHub:
Pokémon - Delta Lakehouse
Modern Data Stack -
Architecture
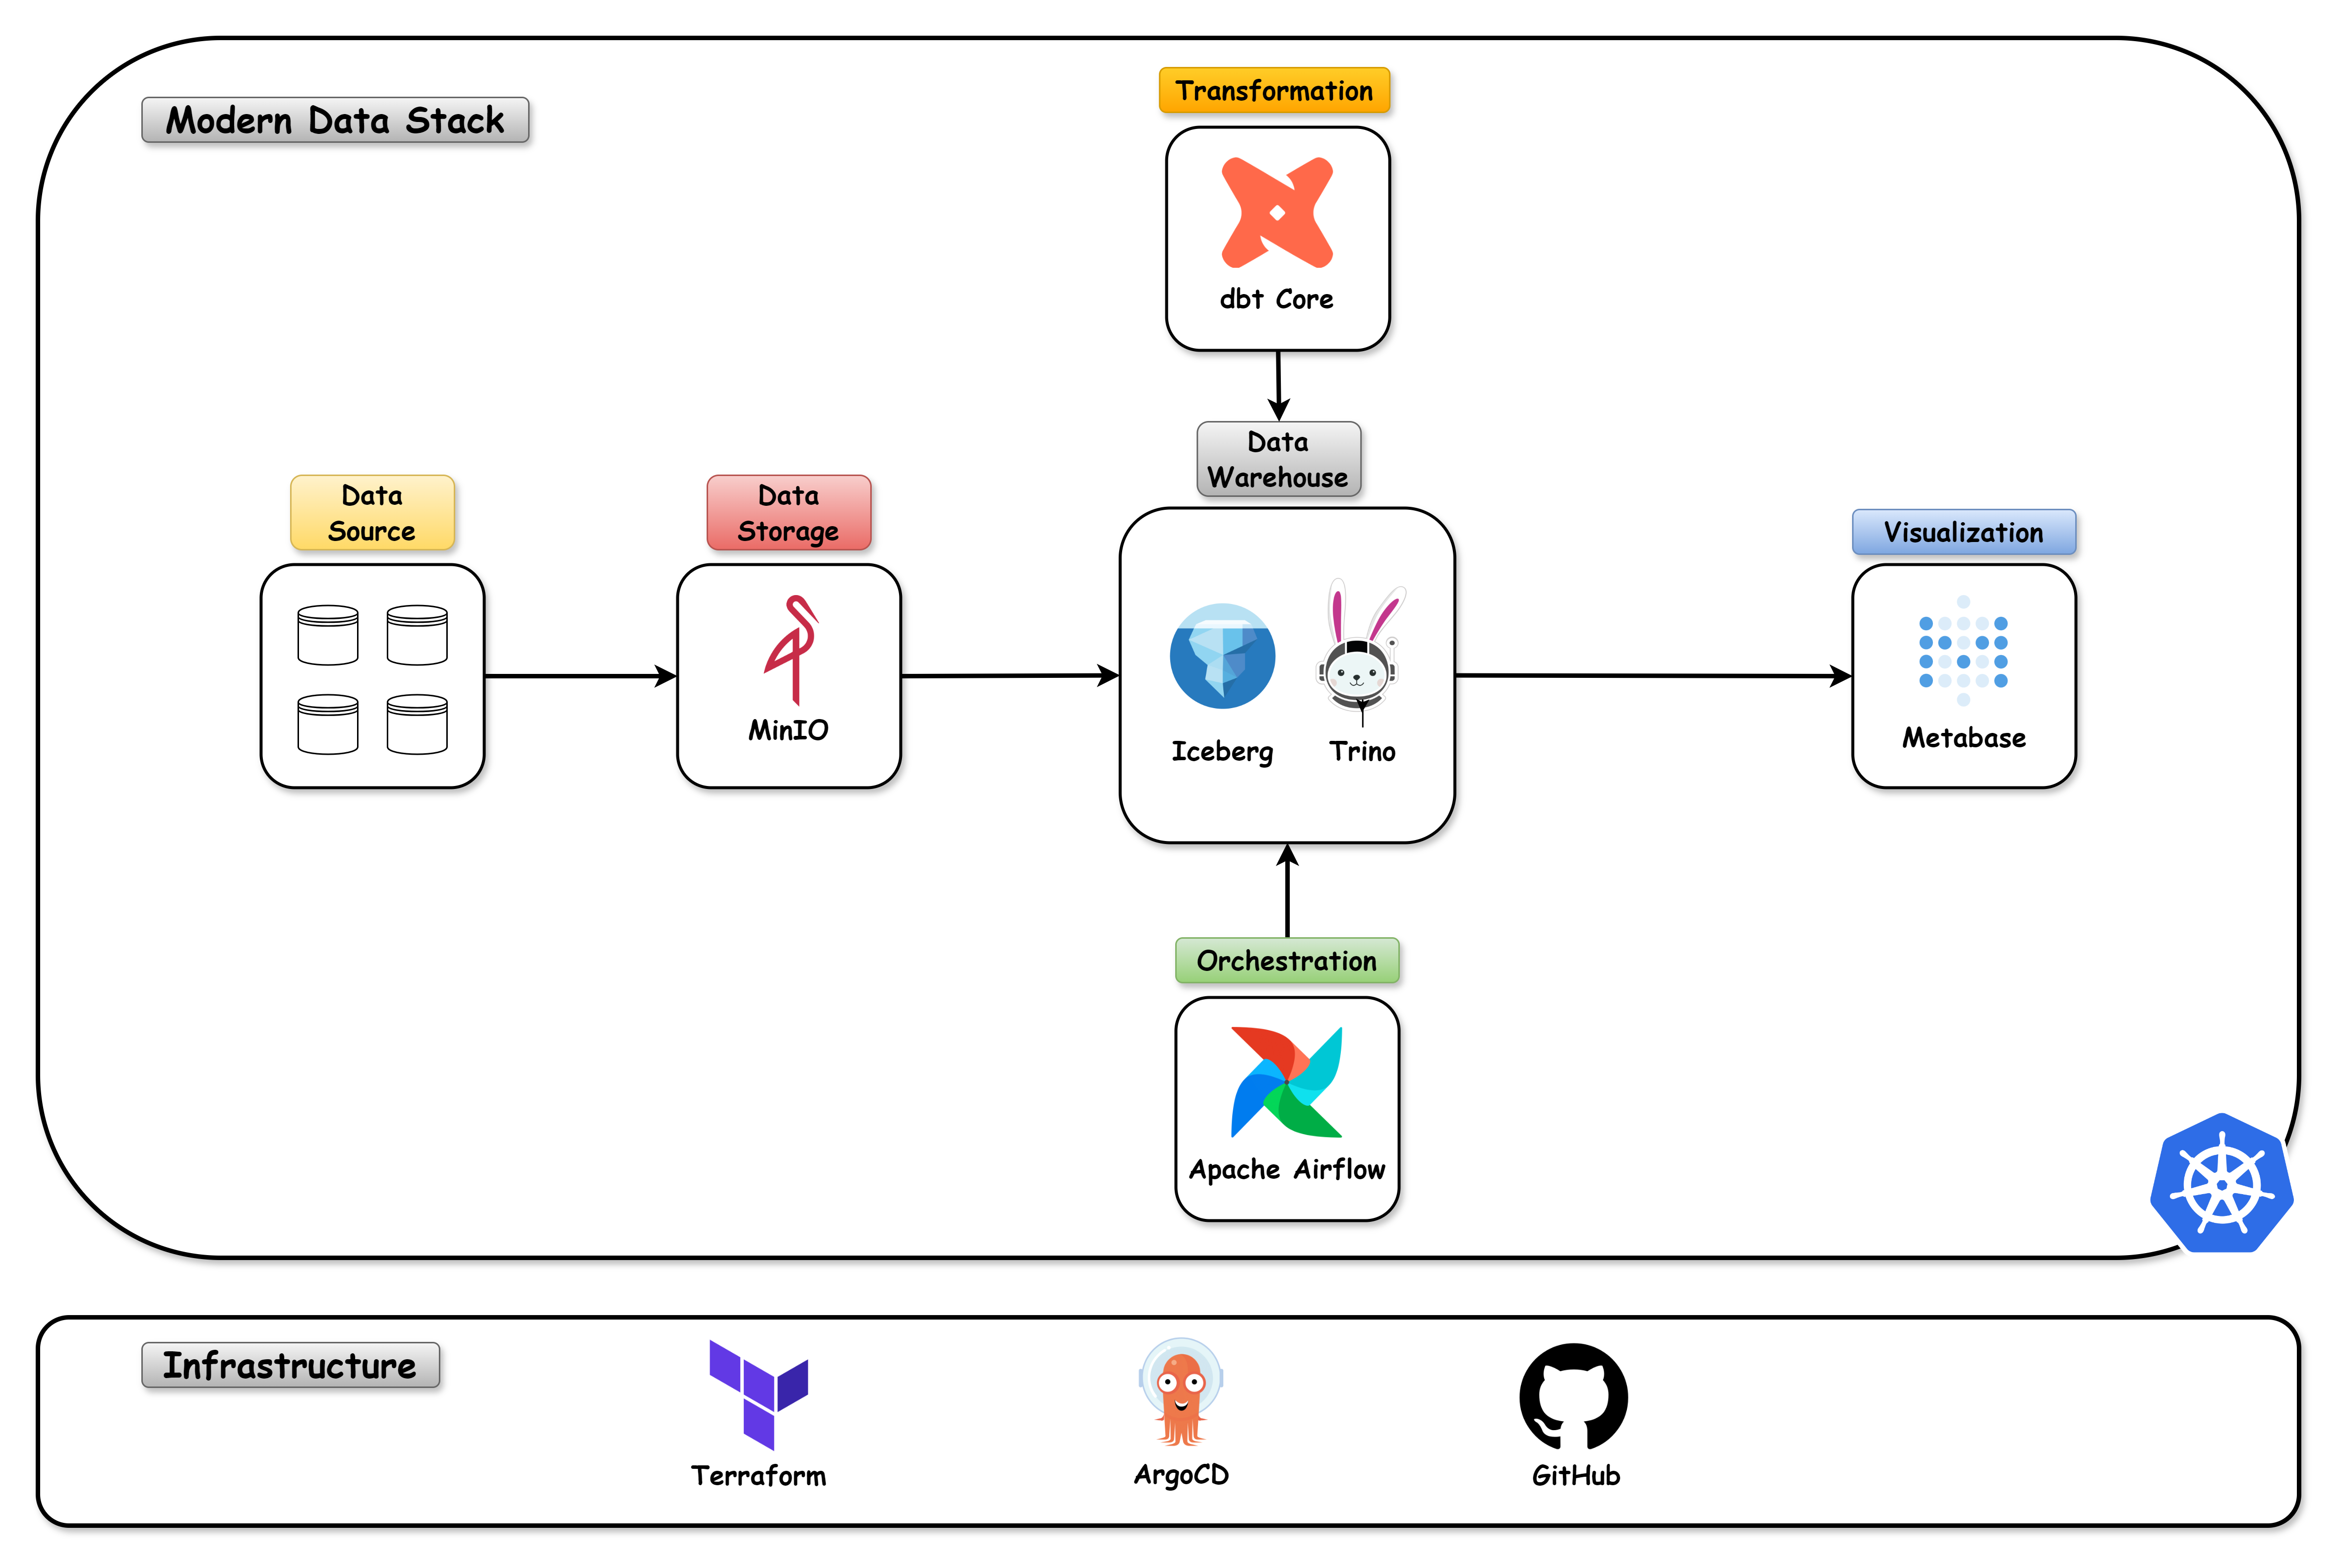
Modern Data Stack with Kubernetes.
More
OVERVIEW
The Modern Data Stack with Kubernetes is a project that aims to create a complete data environment using the best practices of the market. The project is structured in 3 parts:
- Infra: All the resources needed to create a Kubernetes cluster as well as the components needed for the data environment using GitOps.
- Apps: Development of an application that creates files in json or parquet to put in the landing zone folder of a data lake, in this case using MinIO (s3).
- Data: Creation of a data pipeline using Apache Airflow, Trino & dbt-Core to create a complete end-to-end data environment.
Results
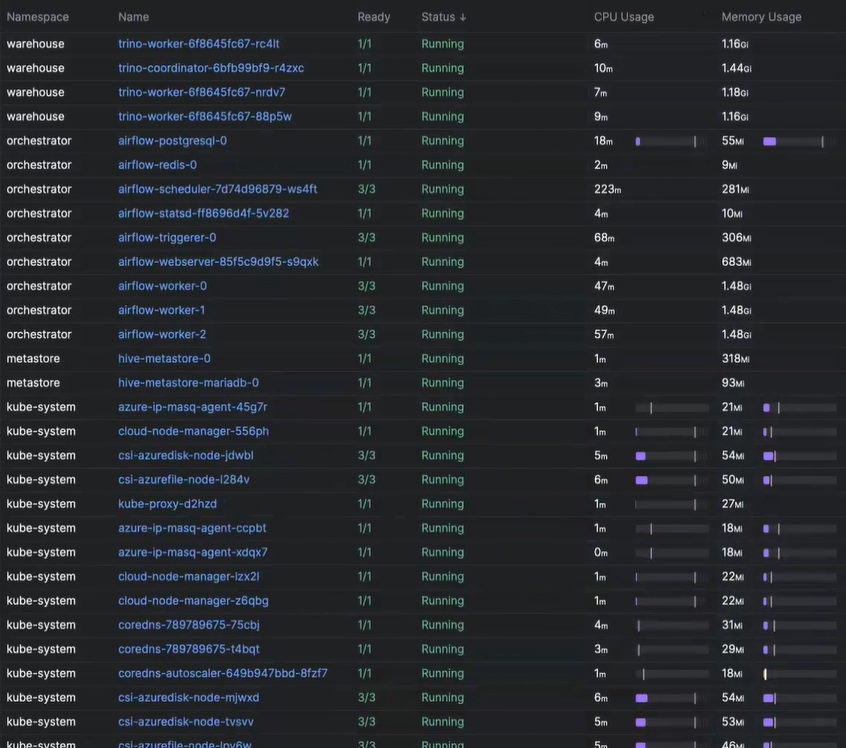
Kubernetes
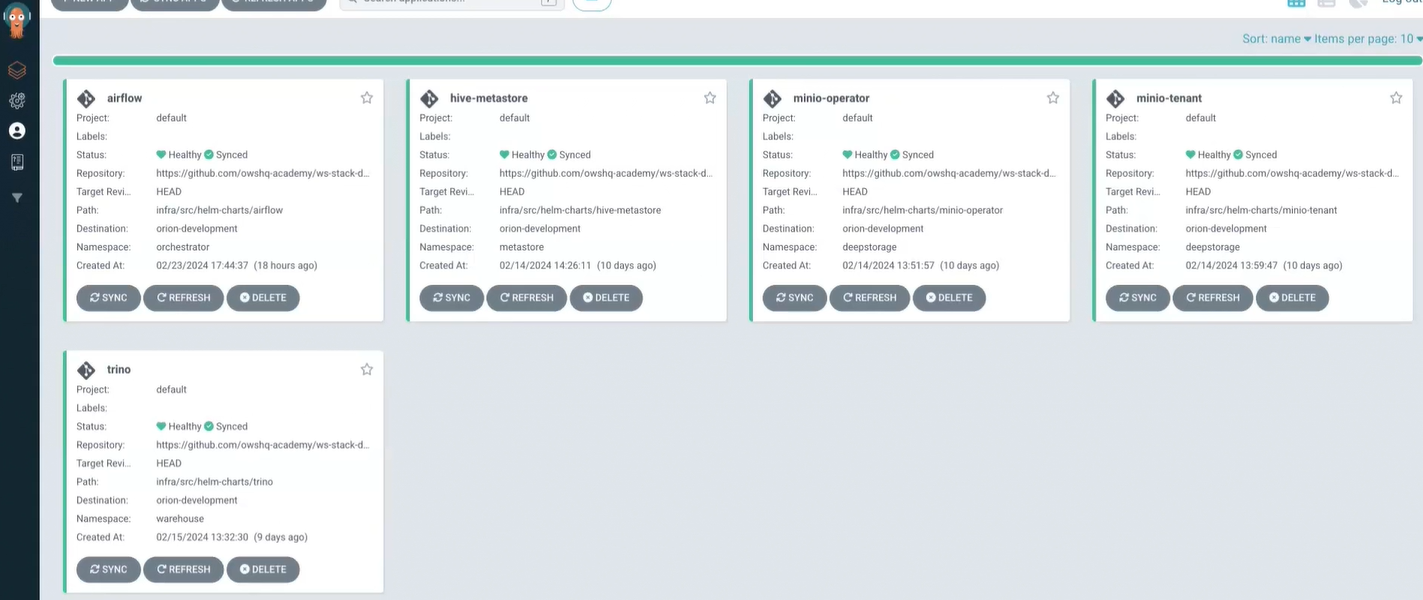
ArgoCD
MinIO
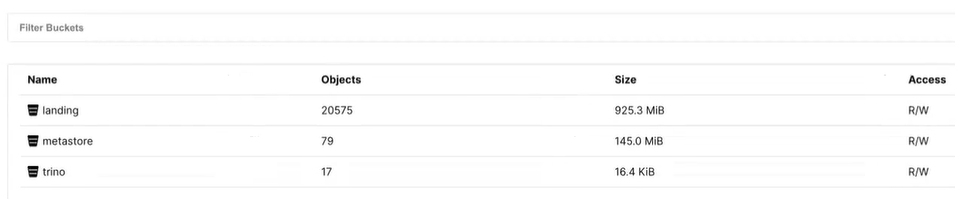
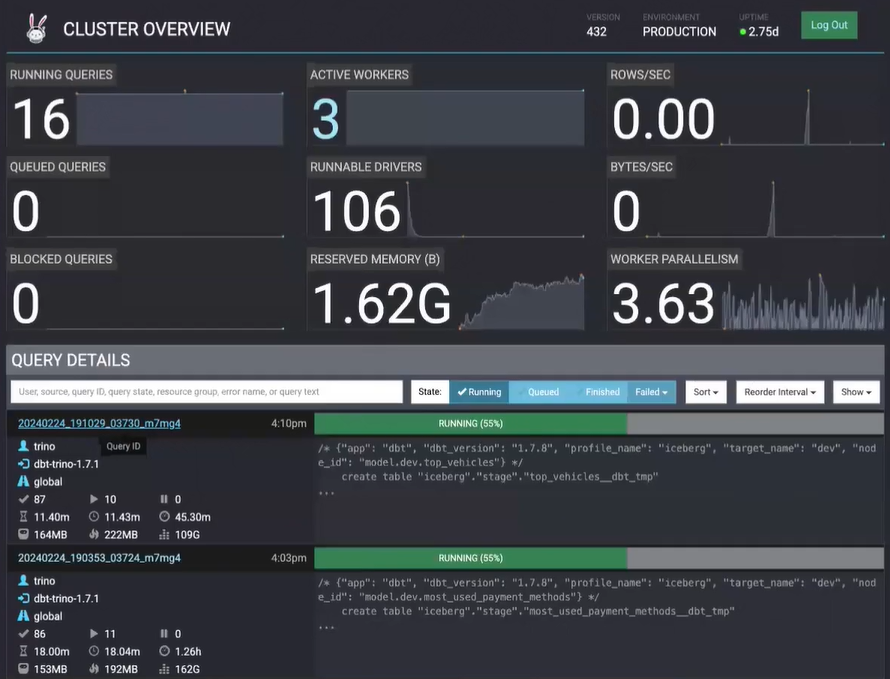
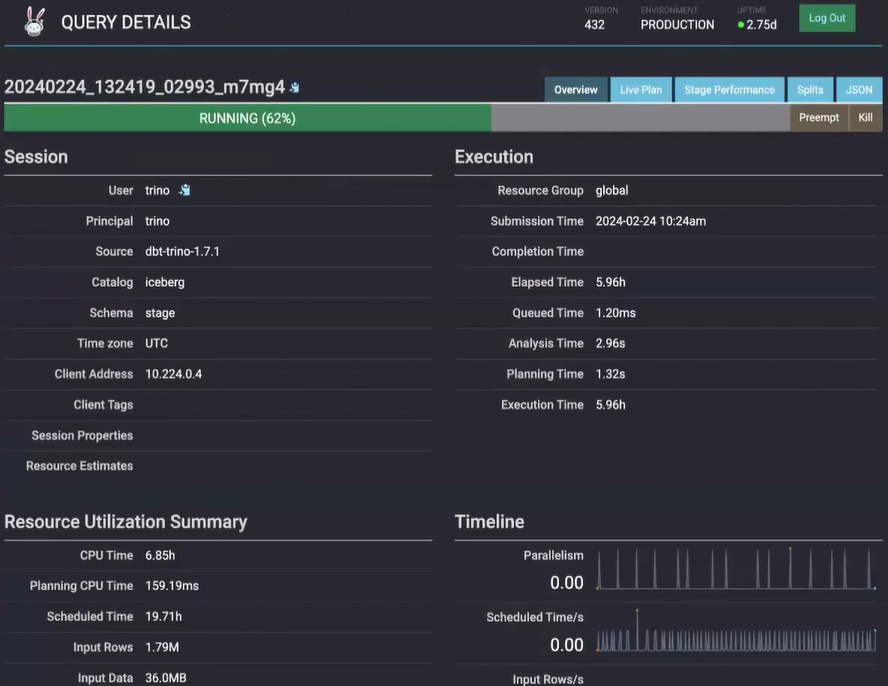
Trino & Iceberg
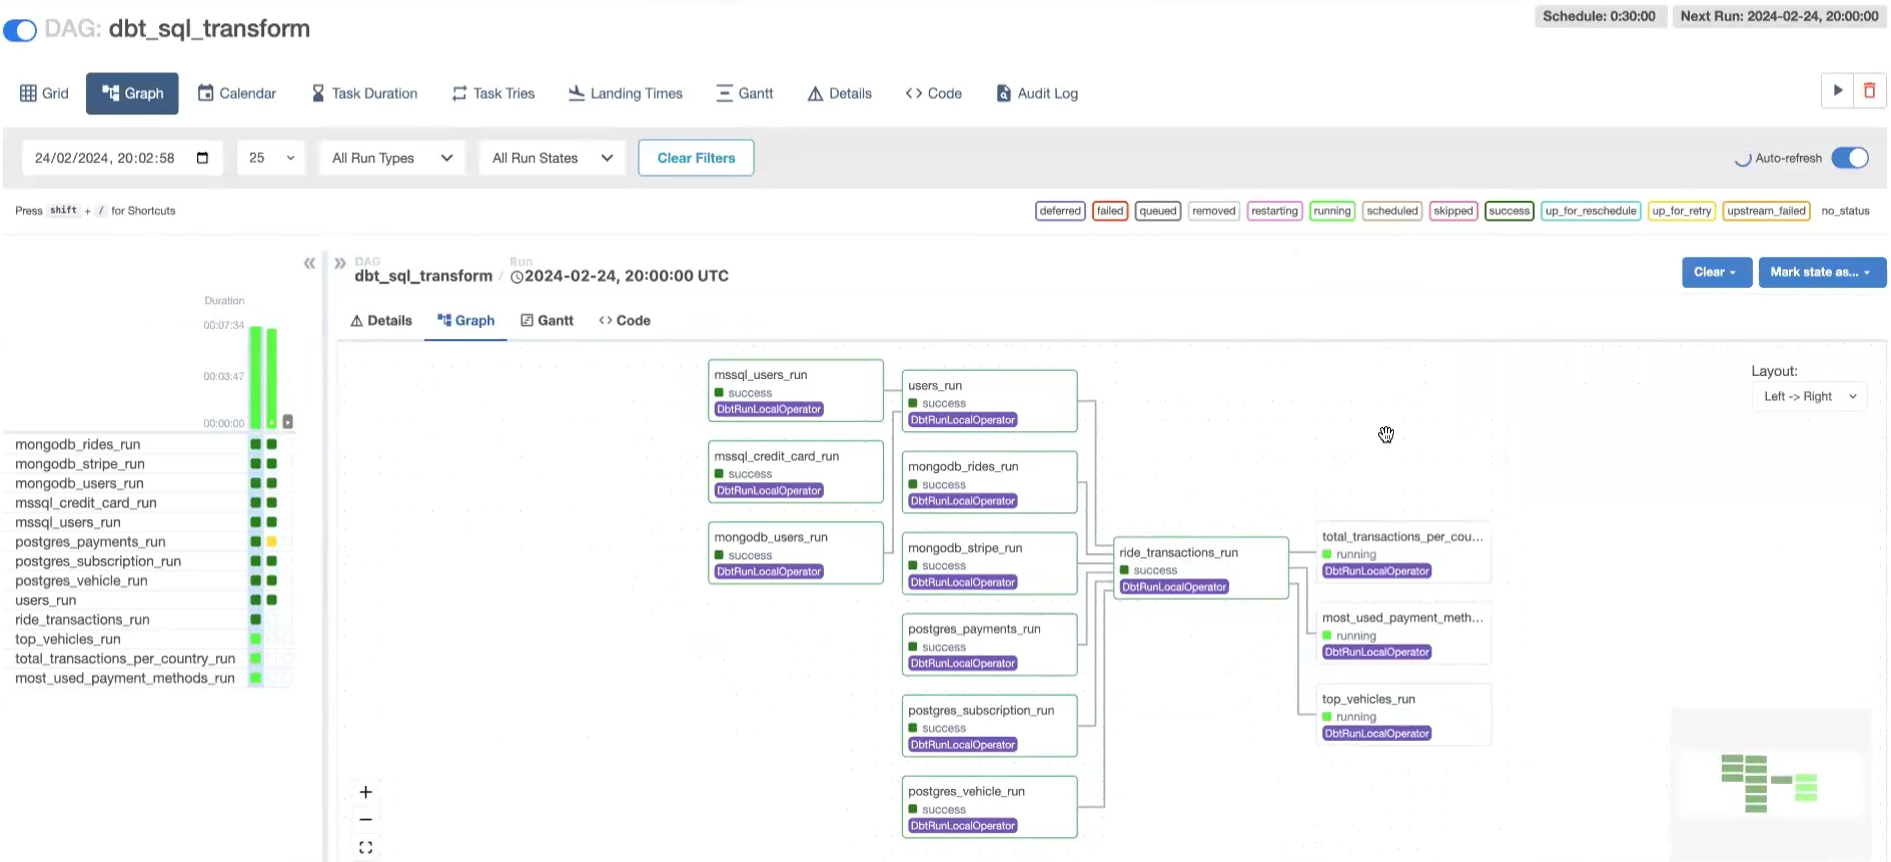
Apache Airflow & dbt-Core
Metabase
Conclusion
The Modern Data Stack with Kubernetes project is a complete data environment that uses the best practices of the market. The project is structured in 3 parts: Infra, Apps and Data. The project uses the following technologies: Kubernetes, ArgoCD, MinIO, Trino, Iceberg, Apache Airflow, dbt-Core and Metabase.
The full project can be viewed on my GitHub:
Modern Data Stack with Kubernetes
Magic: The Gathering -
Data Pipeline
End-to-end batch data pipeline on Magic: The Gathering.
More
OVERVIEW
Magic: The Gathering (colloquially known as Magic or MTG) is a tabletop and digital collectible card game created by Richard Garfield. Released in 1993 by Wizards of the Coast, Magic was the first trading card game and had approximately fifty million players as of February 2023. Over twenty billion Magic cards were produced in the period from 2008 to 2016, during which time it grew in popularity. As of the 2022 fiscal year, Magic generates over $1 billion in revenue annually - Wikipedia
The goal of this project is to build an end-to-end batch data pipeline on Magic: The Gathering Data available at Scyfrall. In addition, perform ELT (Extract Load Transform) daily in order to analyze the cards information availabe from historical data to till date.
Problem Statement
Data
The Data selected for this project is the Magic: The Gathering obtained from Scyfrall. This data includes the latest cards information available. Data since 1993. The Data is extracted via Scryfall API.
Proposed Solution
This project aims at extracting this data from the source via API and building a BATCH ELT which will be scheduled to run daily and update the connected Dashboard for daily Analytics & Reporting.
Data Pipeline Overview
This is a Batch Pipeline which will perform ELT on the every day at 09:00 am.
The ELT steps include:
- Extract dataset from Scryfall via API and load the data into the Datalake
- Clean data and load the data into Datalake
- Load the data from Datalake into external tables in the Data Warehouse
- Transform the data in the Data Warehouse
- Visualize the data by creating a Dashboard
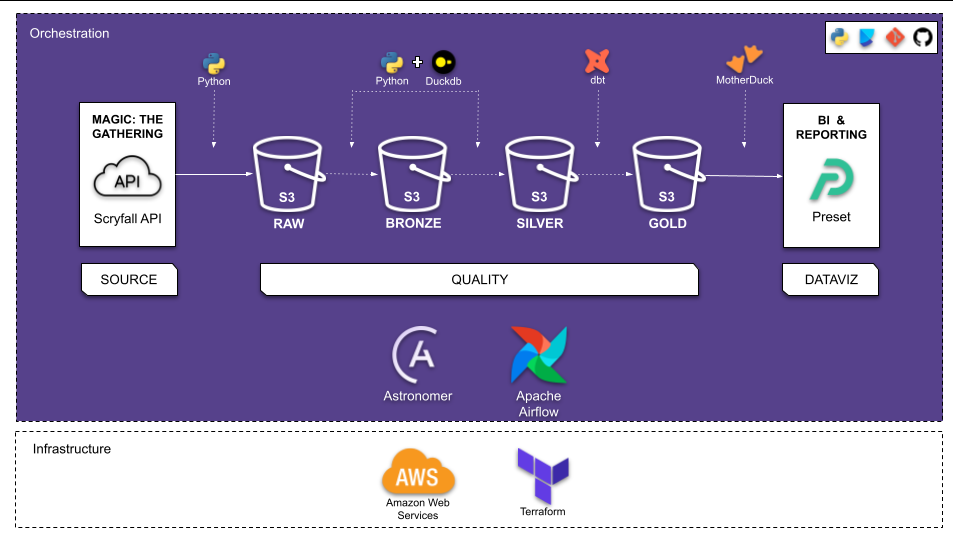
Data Pipeline Architecture
- RAW: where the raw data is placed as soon as it is collected
- BRONZE: data treated and ready to be consumed
- SILVER: data processed and can be consumed easily
- GOLD: data made available from analyzes and models, which can be consumed by BI or DataViz tools
Techonologies
- Cloud: AWS
- Infrastructure as code (IaC): Terraform
- Workflow orchestration: Astronomer + Airflow
- Data Warehouse: MotherDuck
- Batch processing: DuckDb
- Data Transformation: dbt-core
- DataViz: Preset
- Virtual Environment: Poetry
- CICD Git
Architecture
ETL Steps
Steps in the ELT are as follows:
- A Project is created on GitHub
- Infrastructure for the Project is created using Terraform which creates the following:
- Datalake: S3 Bucket where the raw and cleaned data will be stored
- The Pipeline for ELT is created and is scheduled for daily execution. It is orchestrated via Astronomer + Airflow, which does the following tasks:
- Extracts raw data from source via Scryfall API
- Loads raw data as json file to S3 Bucket
- Cleans the raw data using DuckDb
- Loads the cleaned data as parquet files to S3
- Creates External table in the Datasets in MotherDuck by pulling data from S3.
- ransforms Data from S3 using dbt-core and creates the following in the dev/prod Dataset (along with Tests and Documentation)
- The view: "stg_cards"
- The fact table: "fact_cards"
- Transformed Data from MotherDuck is used for Reporting and Visualization using Preset to produce Dashboards
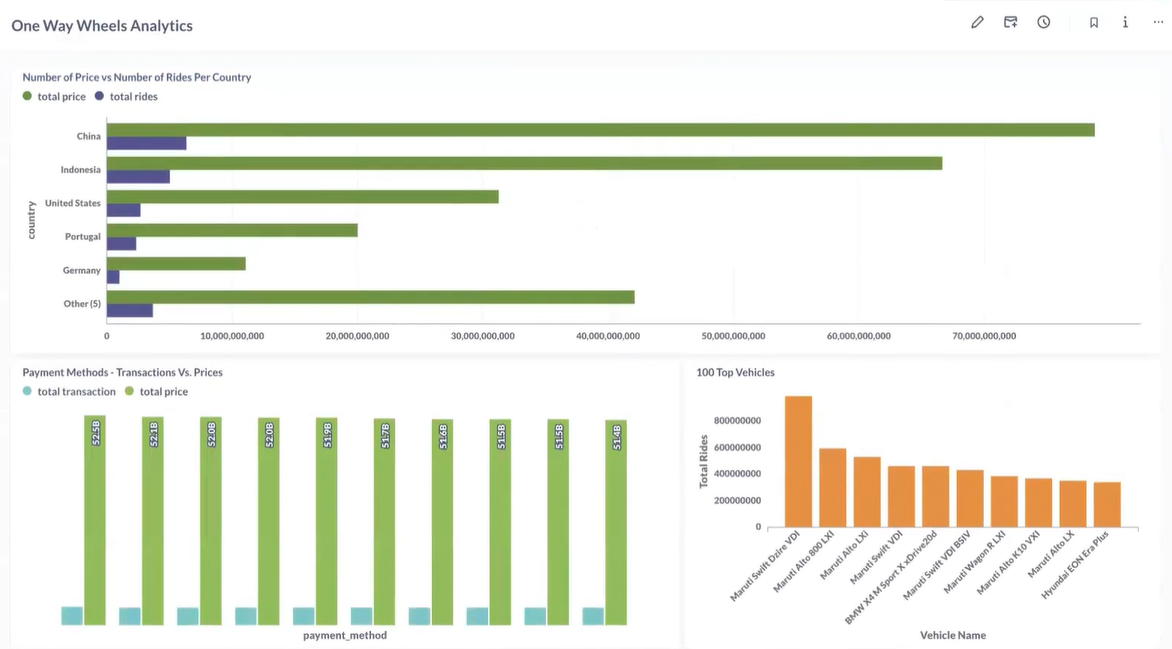
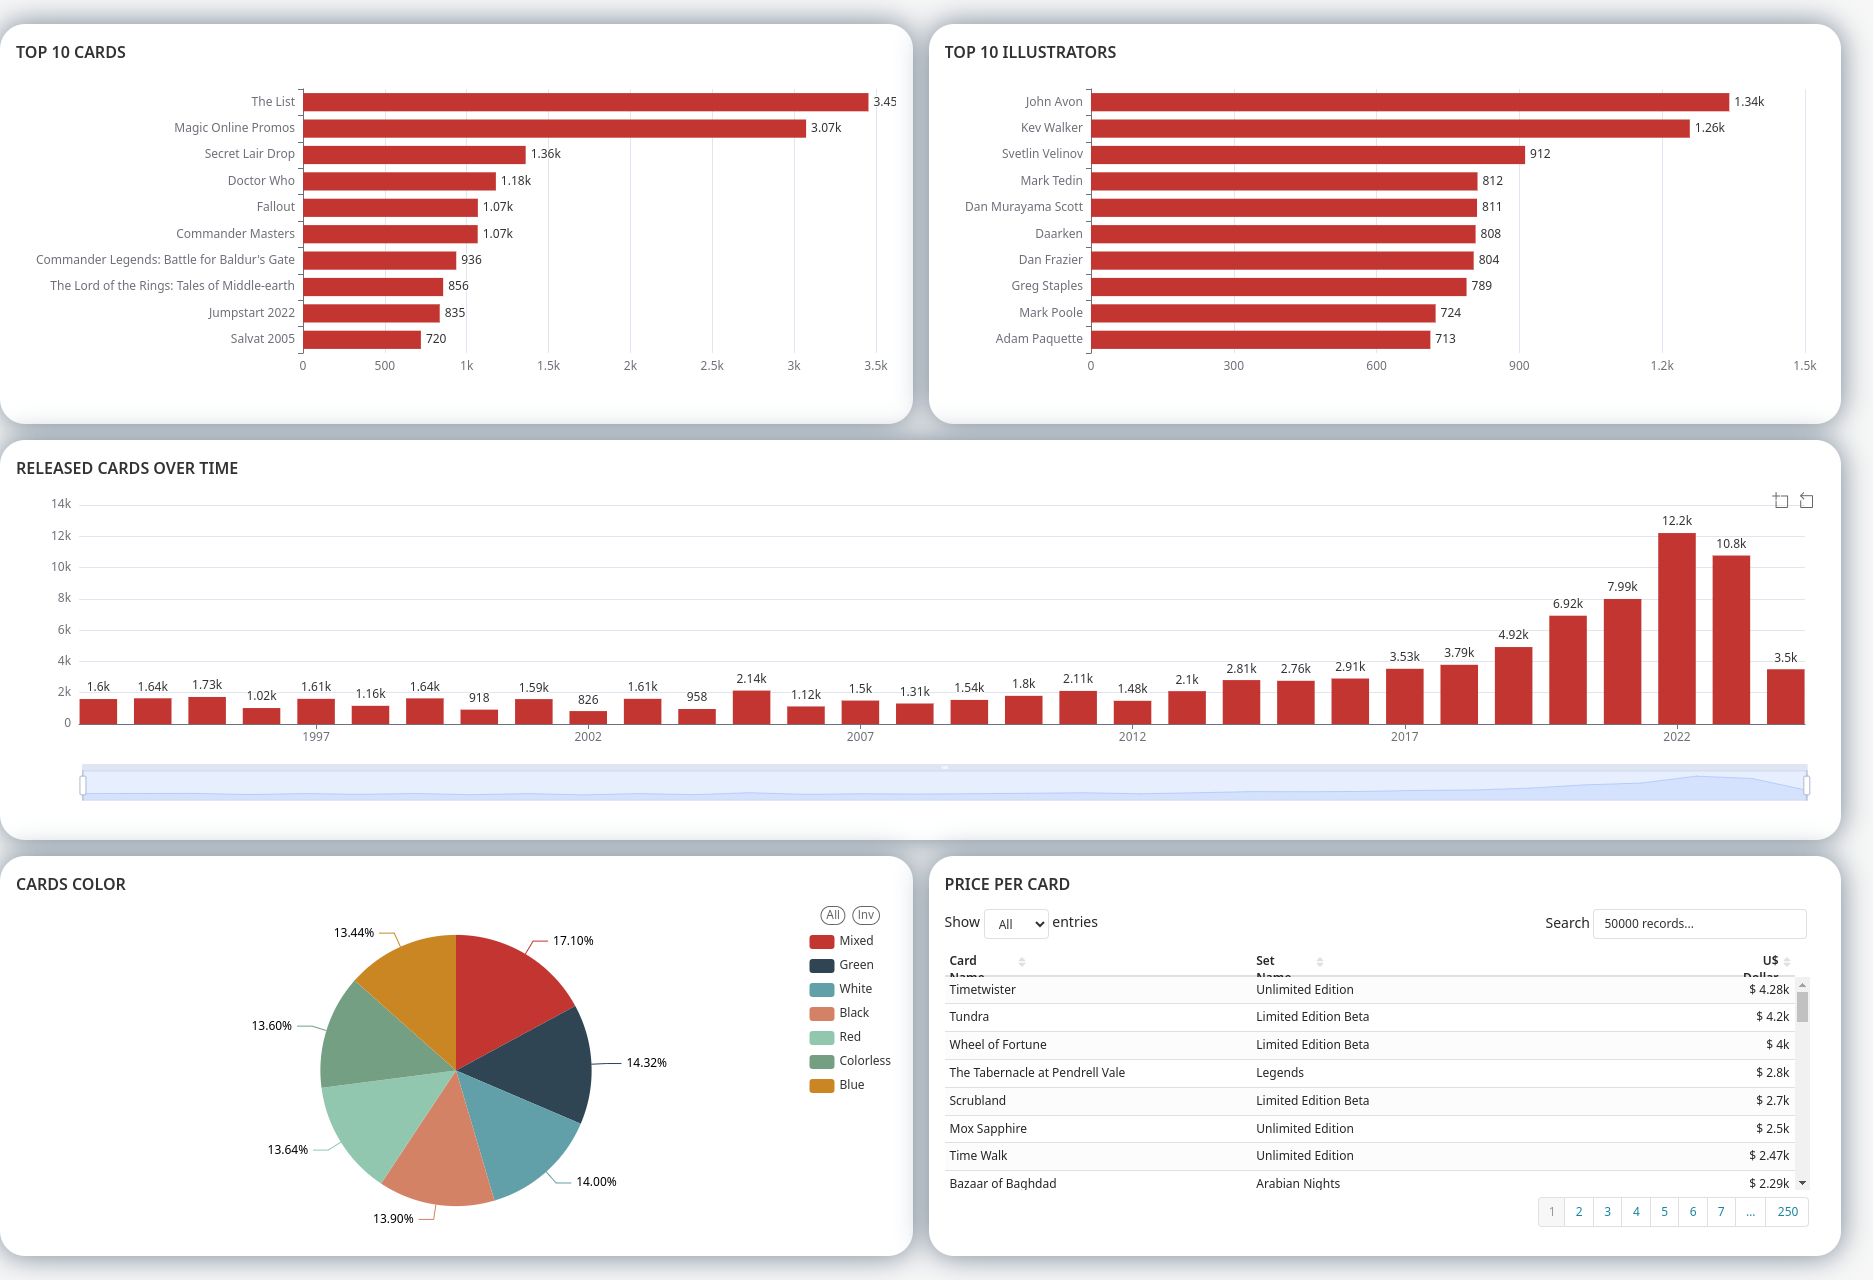
Dashboard
Conclusion
Through this project we were able to successfully build a ELT pipeline end to end which is scheduled to run daily. And as a result we have a daily updated MTG cards which can be visualized via the Dashboard on Preset. This helps us get some useful insights on the latest cards information.
The full project can be viewed on my GitHub:
Magic: The Gathering Pipeline
Esports Earnings -
Data Pipeline
End-to-end batch data pipeline on Esports Earnings Data.
More
OVERVIEW
The goal of this project is to build an end-to-end batch data pipeline on Esports Earnings Data available at Esports Earnings. In addition, perform ELT (Extract Load Transform) monthly in order to analyze the esports earnings patterns from historical data to till date..
Problem Statement
Data
The Data selected for this project is the Esports Earnings obtained from Esports Earnings. This data includes esports earnings filed with the Esports Earnings community-driven competitive gaming resource based on freely available public information. The accuracy of this website is dependent on user contributions. Data since 1998. The Data is extracted via Esports Earnings API.
Proposed Solution
This project aims at extracting this data from the source via API and building a BATCH ELT which will be scheduled to run monthly and update the connected Dashboard for monthly Analytics & Reporting.
Data Pipeline Overview
This is a Batch Pipeline which will perform ELT on the 1st of every month at 07:00 am.
The ELT steps include:
- Extract dataset from Esports Earnings via API and load the data into the Datalake
- Clean data and load the data into Datalake
- Load the data from Datalake into external tables in the Data Warehouse
- Transform the data in the Data Warehouse
- Visualize the data by creating a Dashboard
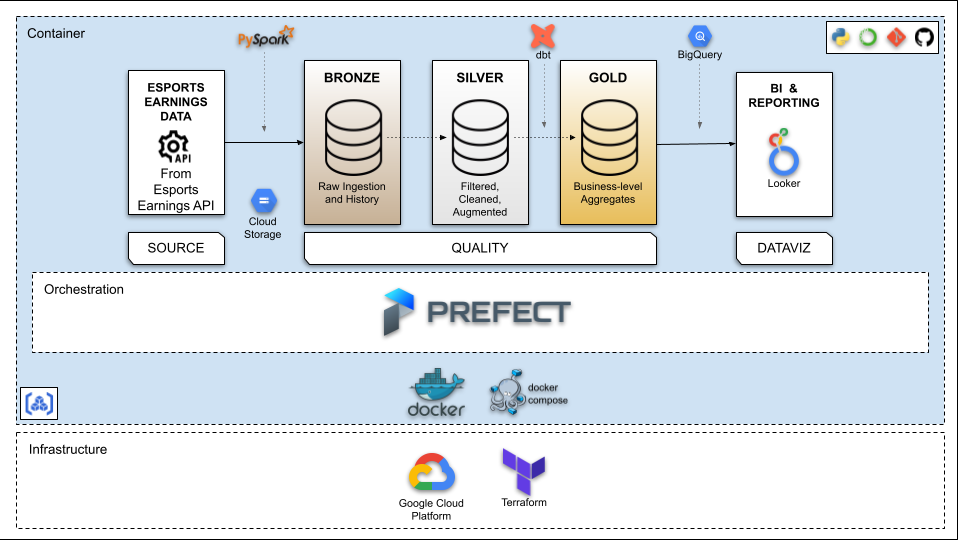
Data Pipeline with Medallion Architecture
- Bronze layer: raw data - parquet format
- Silver layer: cleansed and conformed data - delta format
- Gold layer: curated business-level tables - delta format
Techonologies
- Cloud: GCP
- Infrastructure as code (IaC): Terraform
- Workflow orchestration: Prefect
- Containerization: Docker
- Data Warehouse: BigQuery
- Batch processing: PySpark
- Data Transformation: dbt-core
- DataViz: Looker Studio
- Virtual Environment: Anaconda
- CICD Git
Architecture
ETL Steps
Steps in the ELT are as follows:
- A Project is created on GCP
- Esports Earnings API key is obtained by creating an account on Esports Earnings, which will be used to extract the data from the source.
- Infrastructure for the Project is created using Terraform which creates the following:
- Datalake: Google Cloud Storage Bucket where the raw and cleaned data will be stored
- Data Warehouse: Three Datasets on BigQuery namely "esports_bronze", "esports_silver" and "esports_gold" are created in order to store the tables/views during different stages of ELT
- Artifact Registry: A place to manage the container (Docker) images
- Prefect Cloud API is obtained by creating an account on Prefect Cloud
- The Pipeline for ELT is created on the Docker Image and is scheduled for monthly execution. It is orchestrated via ***Prefect Cloud***; which does the following tasks
- Extracts raw data from source via Esports Earnings Data API
- Loads raw data as parquet files to GCS Bucket
- Cleans the raw data using PySpark
- Loads the cleaned data as delta files to GCS
- Creates External table in the Datasets in BigQuery by pulling data from GCS
- Transforms Data from BigQuery using dbt-core and creates the following in the dev/prod Dataset (along with Tests and Documentation)
- The views "stg_esports_tournaments" and "stg_esports_games_awarding_prize_money"
- Fact tables "fact_esports_teams_tournaments" and "fact_esports_individuals_tournaments"
- Transformed Data from BigQuery is used for Reporting and Visualization using Looker Studio to produce Dashboards
Dashboard
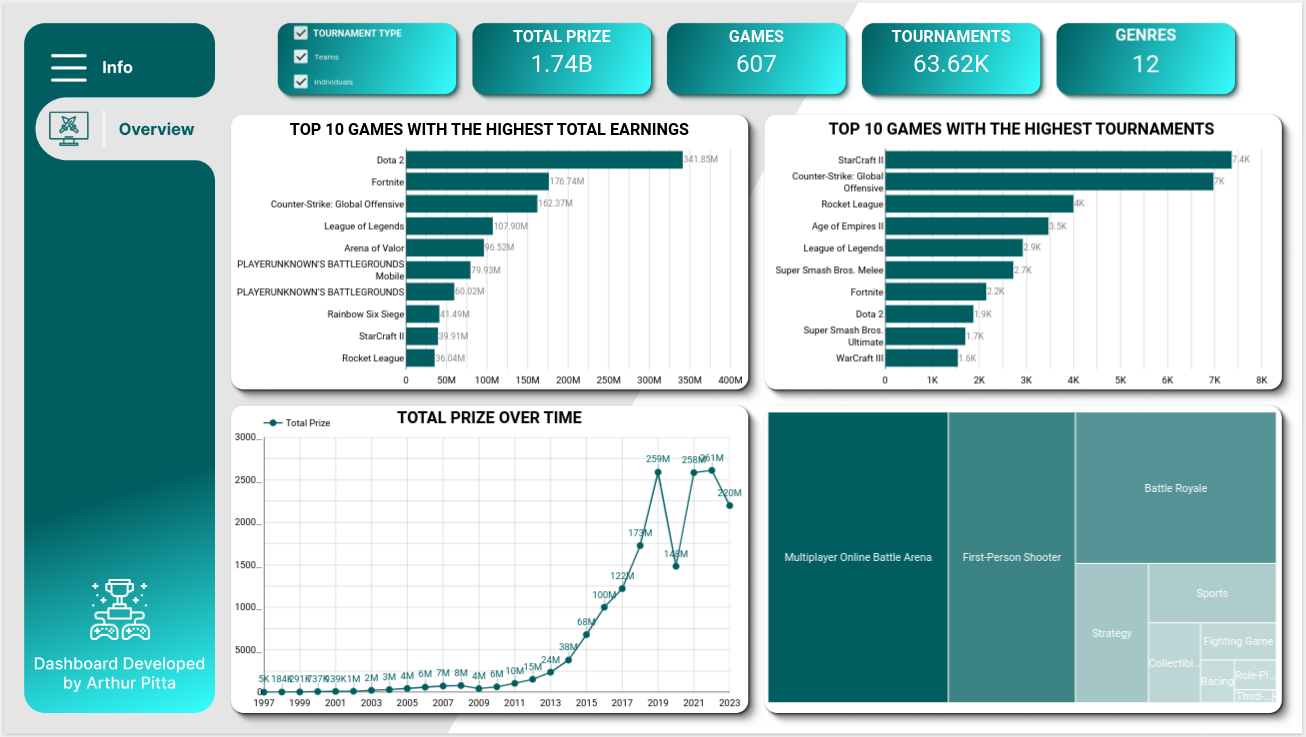
Conclusion
Through this project we were able to successfully build a ELT pipeline end to end which is scheduled to run monthly. And as a result we have a monthly updated Esports Earnings which can be visualized via the Dashboard on Looker Studio. This helps us get some useful insights on the latest esports trends and patterns.
The dashboard can be viewed on my Looker Studio page:
Esports Earnings Report
The full project can be viewed on my GitHub:
Esports Earnings Pipeline
Intro

My name is Arthur Pitta,
I am a Data Engineer and worked as a Business Intelligence Analyst resulting in tangible improvements and significant cost savings for the organization. I have a degree in Physical Education and in my master's and doctorate I used Matlab to process data. I never imagined that while studying Physical Education I would use programming. I confess that at first I was a little scared because I'm not in the area of exact sciences or technology. However, I enjoyed programming from the first contact I had with this new area of knowledge.
Before starting to learn Python, I had worked with MATLAB. Due to the "similarity" between these tools in working with data, I decided to choose Python. So, I started studying python and instead of just liking it, I fell in love with programming. I decided to continue in the web development area, but by coincidence or not, I returned to the data area.
I also have a vocation for teaching, so I decided to create an Instagram and post articles on Medium to share knowledge, content, doubts, difficulties and the reality of those who are learning and working with python.
Contact
Thank you for your contact
I will return as soon as possible
Elements
Text
This is bold and this is strong. This is italic and this is emphasized.
This is superscript text and this is subscript text.
This is underlined and this is code: for (;;) { ... }. Finally, this is a link.
Heading Level 2
Heading Level 3
Heading Level 4
Heading Level 5
Heading Level 6
Blockquote
Fringilla nisl. Donec accumsan interdum nisi, quis tincidunt felis sagittis eget tempus euismod. Vestibulum ante ipsum primis in faucibus vestibulum. Blandit adipiscing eu felis iaculis volutpat ac adipiscing accumsan faucibus. Vestibulum ante ipsum primis in faucibus lorem ipsum dolor sit amet nullam adipiscing eu felis.
Preformatted
i = 0;

while (!deck.isInOrder()) {
    print 'Iteration ' + i;
    deck.shuffle();
    i++;
}

print 'It took ' + i + ' iterations to sort the deck.';
Lists
Unordered
- Dolor pulvinar etiam.
- Sagittis adipiscing.
- Felis enim feugiat.
Alternate
- Dolor pulvinar etiam.
- Sagittis adipiscing.
- Felis enim feugiat.
Ordered
- Dolor pulvinar etiam.
- Etiam vel felis viverra.
- Felis enim feugiat.
- Dolor pulvinar etiam.
- Etiam vel felis lorem.
- Felis enim et feugiat.
Icons
Actions
Table
Default
| Name |
Description |
Price |
| Item One |
Ante turpis integer aliquet porttitor. |
29.99 |
| Item Two |
Vis ac commodo adipiscing arcu aliquet. |
19.99 |
| Item Three |
Morbi faucibus arcu accumsan lorem. |
29.99 |
| Item Four |
Vitae integer tempus condimentum. |
19.99 |
| Item Five |
Ante turpis integer aliquet porttitor. |
29.99 |
|
100.00 |
Alternate
| Name |
Description |
Price |
| Item One |
Ante turpis integer aliquet porttitor. |
29.99 |
| Item Two |
Vis ac commodo adipiscing arcu aliquet. |
19.99 |
| Item Three |
Morbi faucibus arcu accumsan lorem. |
29.99 |
| Item Four |
Vitae integer tempus condimentum. |
19.99 |
| Item Five |
Ante turpis integer aliquet porttitor. |
29.99 |
|
100.00 |